The 1995 Satiety Index study

How filling
is your food?

The 1995 Satiety Index compares how full people felt after eating 240-calorie portions. Browse the original results for 38 foods, with white bread as the reference.

Compare foods / 01 of 38

The 1995 test, at a glance

240
calories per portion
(about 1,000 kJ)
11–13
people per
food group
2 hours
of fullness ratings
every 15 minutes

Equal calories, different portion sizes. Illustrations show the foods, not the exact portions tested.

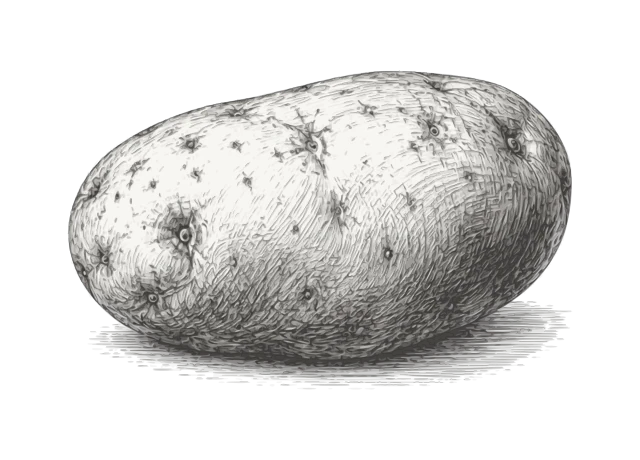
Engraved illustration of Boiled potato
Boiled potato
Swipe to compare foods

Carbohydrate-rich foods

Boiled potato

Boiled potatoes had the highest average score of the 38 foods tested.

323%

368 g≈240 kcal portion

Protein
10.0 g
Carbs*
49.0 g
Fat
1.0 g

1995 study score. White bread = 100%.

3.23×

the measured fullness response to white bread, for the same calories.

*Carbs = sugars + starch; fibre listed separately.

Full nutrition & study details
Energy
1,000 kJ / ≈240 kcal
Sugars
3.1 g
Starch
45.9 g
Fibre
9.2 g
Water in food
290.8 g

Peeled, boiled, refrigerated overnight, then reheated.

All values are for this study portion. Each food was also served with 220 ml drinking water, separate from these figures.

The paper reports weight, not food volume. Illustrations are not to scale.

1995 values; preparation and modern products may differ.

Values are reproduced as reported; some rows do not reconcile exactly.

Source: original paper, Tables 1–2 (PDF)
See all 38 foods

How the
study worked

In 1995, S.H.A. Holt and colleagues at the University of Sydney compared how filling 38 foods were.

Each test portion contained 1,000 kJ, about 240 calories. Groups of 11 to 13 people rated how full they felt every 15 minutes for two hours. Researchers combined those ratings into a score, with white bread set at 100%.

38

foods tested

240 kcal

in each test portion, approximately

2 hours

of recorded fullness ratings

A score of 200% means twice the measured fullness response to white bread, not twice as long without hunger. These are group averages, not personal predictions.

All 38 foods

Original 1995 study scores. White bread = 100%.
Weights are for ≈240-calorie study portions; cereals include milk.

    Beyond the original index

    What newer
    research says

    Reviewed

    Fullness also depends on food texture, preparation and the rest of the meal.

    The 38 scores above remain the 1995 results. These newer studies use different methods and cannot be combined into an updated ranking.

    October 2026 issue

    43 men · Four test meals

    Texture changes the fullness response

    A harder-textured ultra-processed meal produced a 32% greater fullness response over two hours than its softer counterpart, at the same calories. Participants also ate less at the snack afterwards.

    Keep in mind: Total daily calorie intake did not differ significantly. Results apply to these test meals.

    Read the texture and fullness study

    July 2026

    15 adults · New Zealand pilot

    The rest of the meal matters

    Adding lamb or soy protein to potato, pasta or rice suppressed appetite more than eating the carbohydrate foods alone. Both protein sources had similar effects on appetite.

    Keep in mind: This small trial measured short-term appetite, not subsequent food intake or weight change.

    Read the protein and mixed-meal study

    Online November 2025

    41 adults · Two 14-day diets

    Slower-eating foods can reduce intake

    Participants ate around 369 fewer calories per day on an ultra-processed menu with textures that slowed eating, compared with a faster-eating menu. The difference persisted across the two weeks.

    Keep in mind: Researchers changed food textures, not instructions to chew slowly. Long-term weight loss was not tested.

    Read the eating-rate trial

    2024

    26 adults · Potato versus rice meals

    Potatoes in mixed meals

    With meatballs or a vegetarian substitute, participants ate 23–25% fewer calories at meals with instant mash or baked fries than with rice. Including a pizza meal two hours later, total intake was still 13–16% lower.

    Keep in mind: A short-term, potato-industry-funded trial of specific preparations, not evidence of long-term weight loss.

    Read the potato and rice study

    Feeling fuller, eating less and losing weight over time are different outcomes. These trials do not measure all three.